

Letting the Ice Speak
Climate scientist Zach Labe talks about Arctic warming, data visualization, and the art of science communication.

👋 Hello to 3,367 climate buddies 🌳
Delphi Zero explores the interplay of climate, energy, and security 🌳🔋🛡️
📧 If you are opening this essay in your email inbox, I recommend clicking on the title of this piece to enjoy the full-length version in the browser.
Hi friends, it’s been a while.
How are you and how have you been? Feel free to respond via email. I’m curious.
On my end, I’ve been tinkering and working on a larger project that I will share soon-ish with all of you. Hint: it’s related to today’s interview.
It’s time to get this publication firing from all cylinders again. There’s no better way to cold start it than by talking to a climate scientist who let’s ice speak for itself 🧊
If your social feed looks anything like mine, then you’ve certainly come across our guests work. His name is Zach Labe and he produces the most beautiful data visualizations about climate trends (in particular data about the polar regions).

Also, he has one of the coolest personal websites I’ve seen around. Go check it out.
We discussed:
How having a weather diary as a child informed his career choice further down the line 📔
What people most commonly misunderstand about the Arctic 🧊
And why letting data do the talking is the art of science communication 📊
Enjoy ✌️
Letting the Ice Speak
By Art Lapinsch
What do you do and how does a regular work week look like for you?
I am a climate scientist at Climate Central. We are a policy-neutral 501(c)(3) nonprofit focused on researching and communicating the science and impacts of our changing climate.
My work is part of our new program on climate services, which focuses on improving our understanding of current and future climate risks, as well as translating and communicating complex climate science data for actionable decision-making.
My day-to-day usually blends scientific research, data visualization, and science communication across a range of interdisciplinary topics.
I really enjoy the opportunity to dig into open questions in climate science, especially around regional impacts and uncertainties in future climate projections, while also thinking creatively about how to communicate these findings clearly and effectively to the public.
How did you end up in climate? In hindsight, was there a defining moment that set you on the path you’re currently on? Why this moment?
You could best describe me as a weather nerd.
I have always been fascinated by the weather and still find myself staying up late watching big storms move through, just like I did as a kid. I even used to keep a weather diary.
However, growing up I had little exposure to climate change in school and only began to understand its relevance in early college. After spending a summer learning how to do scientific research, which was on how the timing of spring plant blooming may shift in a warming climate, I realized I wanted to use my passion for meteorology to better understand the relationship between climate change and extreme weather impacts.
I also did not originally intend for science communication and data visualization to play such a central role in my career, but I think that has become some of my most important contributions as a scientist, especially at this critical moment in time.
What was your favorite weather phenomenon as a kid? Why? What is it as an adult? Has it changed (if so why)?
My favorite weather is snow, and that has definitely not changed.
I have already had several late nights tracking winter storm updates on my computer this winter and taking measurements outside throughout the night. Part of what drew me to Arctic climate research is that the high latitudes contain important climate signals and oscillations that meteorologists use to forecast changes in the winter storm track (i.e., the polar jet stream), and the likelihood of cold air outbreaks.
One major area of ongoing climate research is understanding potential connections between Arctic change and winter weather farther south.
When you talk to people who don’t work in climate, what’s something that catches their attention? Why?
Everyone loves talking about the weather, and almost everyone has a story about a powerful storm or something they have noticed changing in their own backyard.
A big part of communicating climate science is connecting those stories and local observations to the data itself.

One of my goals in science communication is to help translate this information and make it relevant to people’s everyday experiences. I also really enjoy showing visuals about the Arctic and Antarctic to help connect the science in these far away places.
What’s your favorite personal weather story that you like to tell? Why?
One of my first weather-related trips as a kid was to the Mount Washington Observatory in New Hampshire, often nicknamed home to “the world’s worst weather.”

Founded in 1932, the high-elevation observatory has a long history of recording extreme conditions. This includes a world record 231 mph wind gust. Its location near the U.S. east coast storm track and unique mountain geography make it a rare place to observe extreme weather year-round, especially in winter.
During my visit, we were given a behind-the-scenes tour of the observatory, which is permanently staffed during winter too. I even tested out my first handheld anemometer, which measured wind gusts over 60 mph during our visit. It was an unforgettable experience that helped spark my appreciation for the importance of long-term weather and climate data monitoring.
What’s a thing that most people understand well about the Arctic? Why?
I think most people recognize that the Arctic is changing very quickly.
In fact, the Arctic is warming more than three times faster than the global average. This amplified warming is driven by feedbacks within the climate system, and changes in the Arctic have been one of the earliest and clearest indicators of human-caused climate change for decades now.
What’s a thing that most people misunderstand about the Arctic? Why?
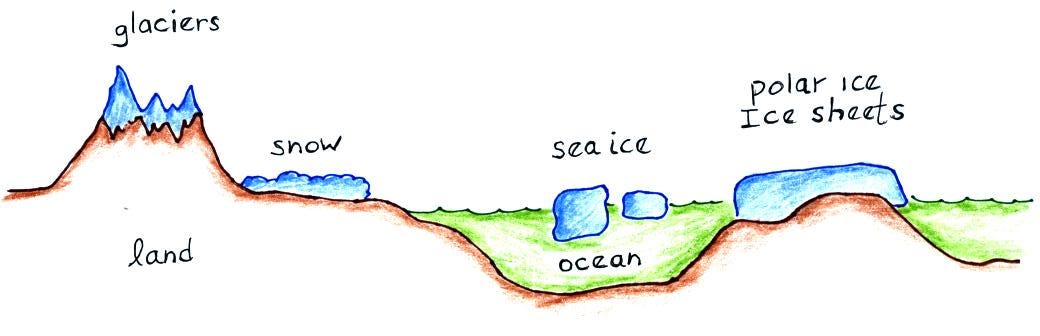
Beyond the challenge of explaining how changes in a place as remote as the Arctic can affect weather and climate around the world, another key concept that is often new to people is the difference between types of ice.
For example, there are important distinctions between sea ice and land ice (e.g., glaciers and the Greenland Ice Sheet), and each has very different consequences as it changes.
In short, sea ice is frozen ocean water and largely does not contribute to global sea level rise (e.g., think of an ice cube floating in a glass of water), unlike melting ice from Greenland and mountain glaciers.
If you’d have to highlight one particular data story of yours, which would it be? Why is it important? What would you like people to take away from it?
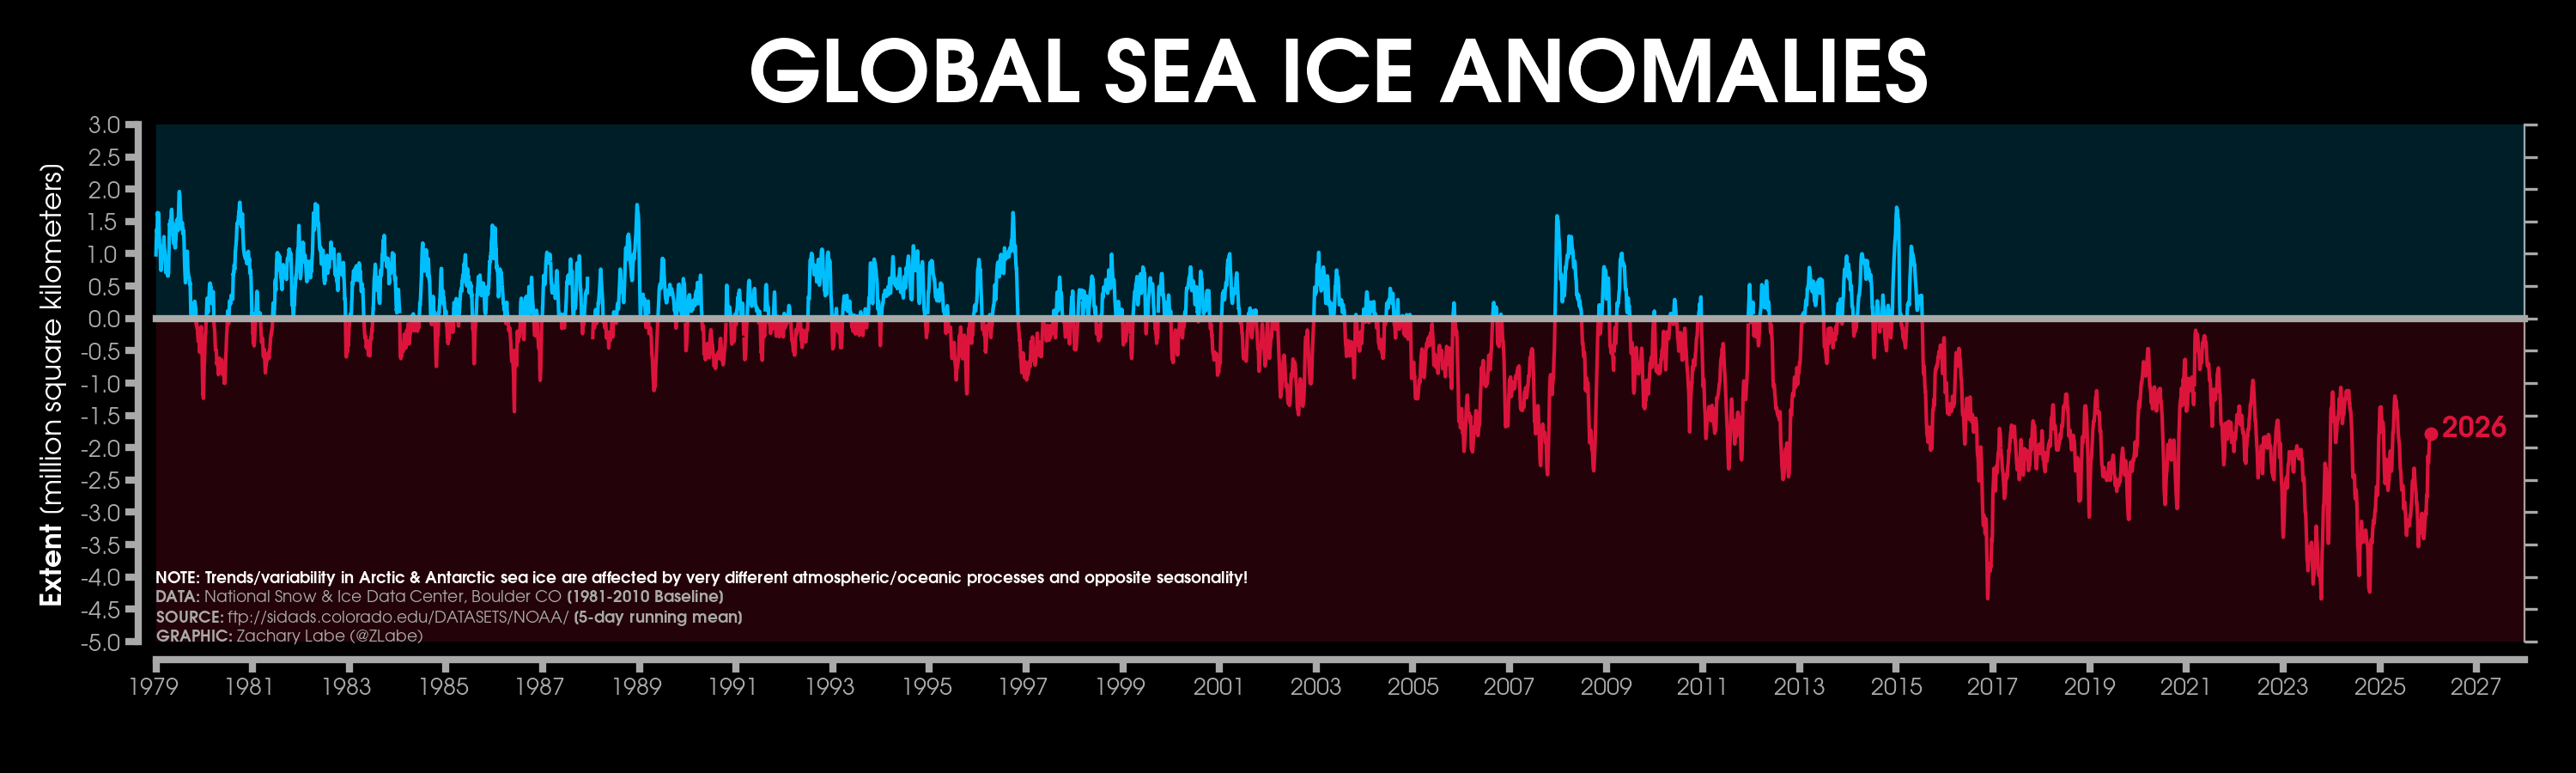
One of my favorite climate data visualizations is an animation showing how Arctic sea-ice volume has changed since 1979, the start of the satellite record.
The graphic is intentionally simple and uses just two bar graphs. A static bar provides a reference for what we consider a “normal” amount of sea-ice volume, accounting for both ice thickness and total area, while an animated bar shows how that volume changes from year to year. Visual cues like color and motion highlight the main story, which is the long-term decline in Arctic sea-ice volume.
In fact, 2025 recorded the lowest annual average on record. The loss of thicker and older Arctic sea ice suggests that the region is transitioning into a new state, with far-reaching consequences for both the environment and society. I think simple visualizations like this can be incredibly powerful for communicating complex climate change topics, and one of my key recommendations in science communication is to be bold and keep it simple.
Playing devils advocate here. Why should people care about the Arctic sea-ice volume? What kind of real-world impact does it have for someone in North America, South America, Europe, Africa, or Asia?
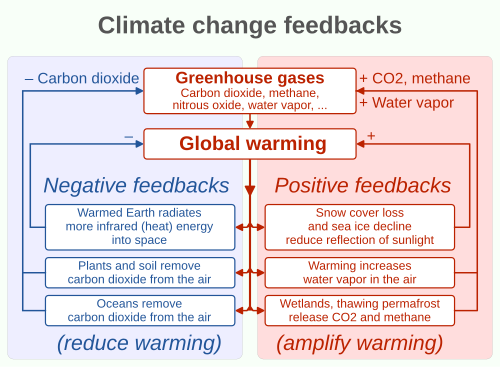
In short, the loss of Arctic sea-ice volume directly amplifies global warming.
With less sea ice during summer, more dark ocean water is exposed, which absorbs incoming sunlight rather than reflecting it back into space (i.e. Albedo Effect) like bright snow and ice.
When the ocean refreezes in fall, much of that stored heat is released back into the atmosphere, driving further warming and additional ice loss.
If I could have one question answered, it would be this: What is the long-term impact of climate change on deep ocean ecosystems — especially those we’ve never even seen?
Because while we focus on surface-level changes — melting sea ice, rising temperatures — the deep ocean is absorbing most of the planet’s excess heat and carbon. It’s like the ocean is quietly holding our mistakes, and we don’t yet fully understand what it’s costing.
- Anya Astafurova in our recent interview “The Ocean Is Everything”
This is a process known as a positive feedback in climate science.
Rapid Arctic warming may also influence extreme weather, including persistent summer patterns that can lead to prolonged heat waves or droughts across highly populated regions of North America, Europe, and Asia.
Beyond climate impacts, declining sea ice has geopolitical and economic implications, such as increased shipping access or interest in natural resources. It also directly affects marine ecosystems, with cascading consequences for fisheries and the broader food web.
What is something that you have changed your mind about since entering the climate space? What is something you have doubled down on? Why?
One thing I have changed my mind about since entering the climate space is the role of data in science communication.

To my surprise, data visualization has become one of the most effective ways for me to reach large audiences and share climate change information. In some ways, this ran counter to guidance I heard early on in science communication workshops, which often emphasized avoiding numbers and facts and focusing instead on human-centered stories. While different approaches matter for different audiences, I now believe that climate data stories can be just as effective for connecting with people. I also believe that regularly translating complex data and science also helps build trust and transparency in the research process.
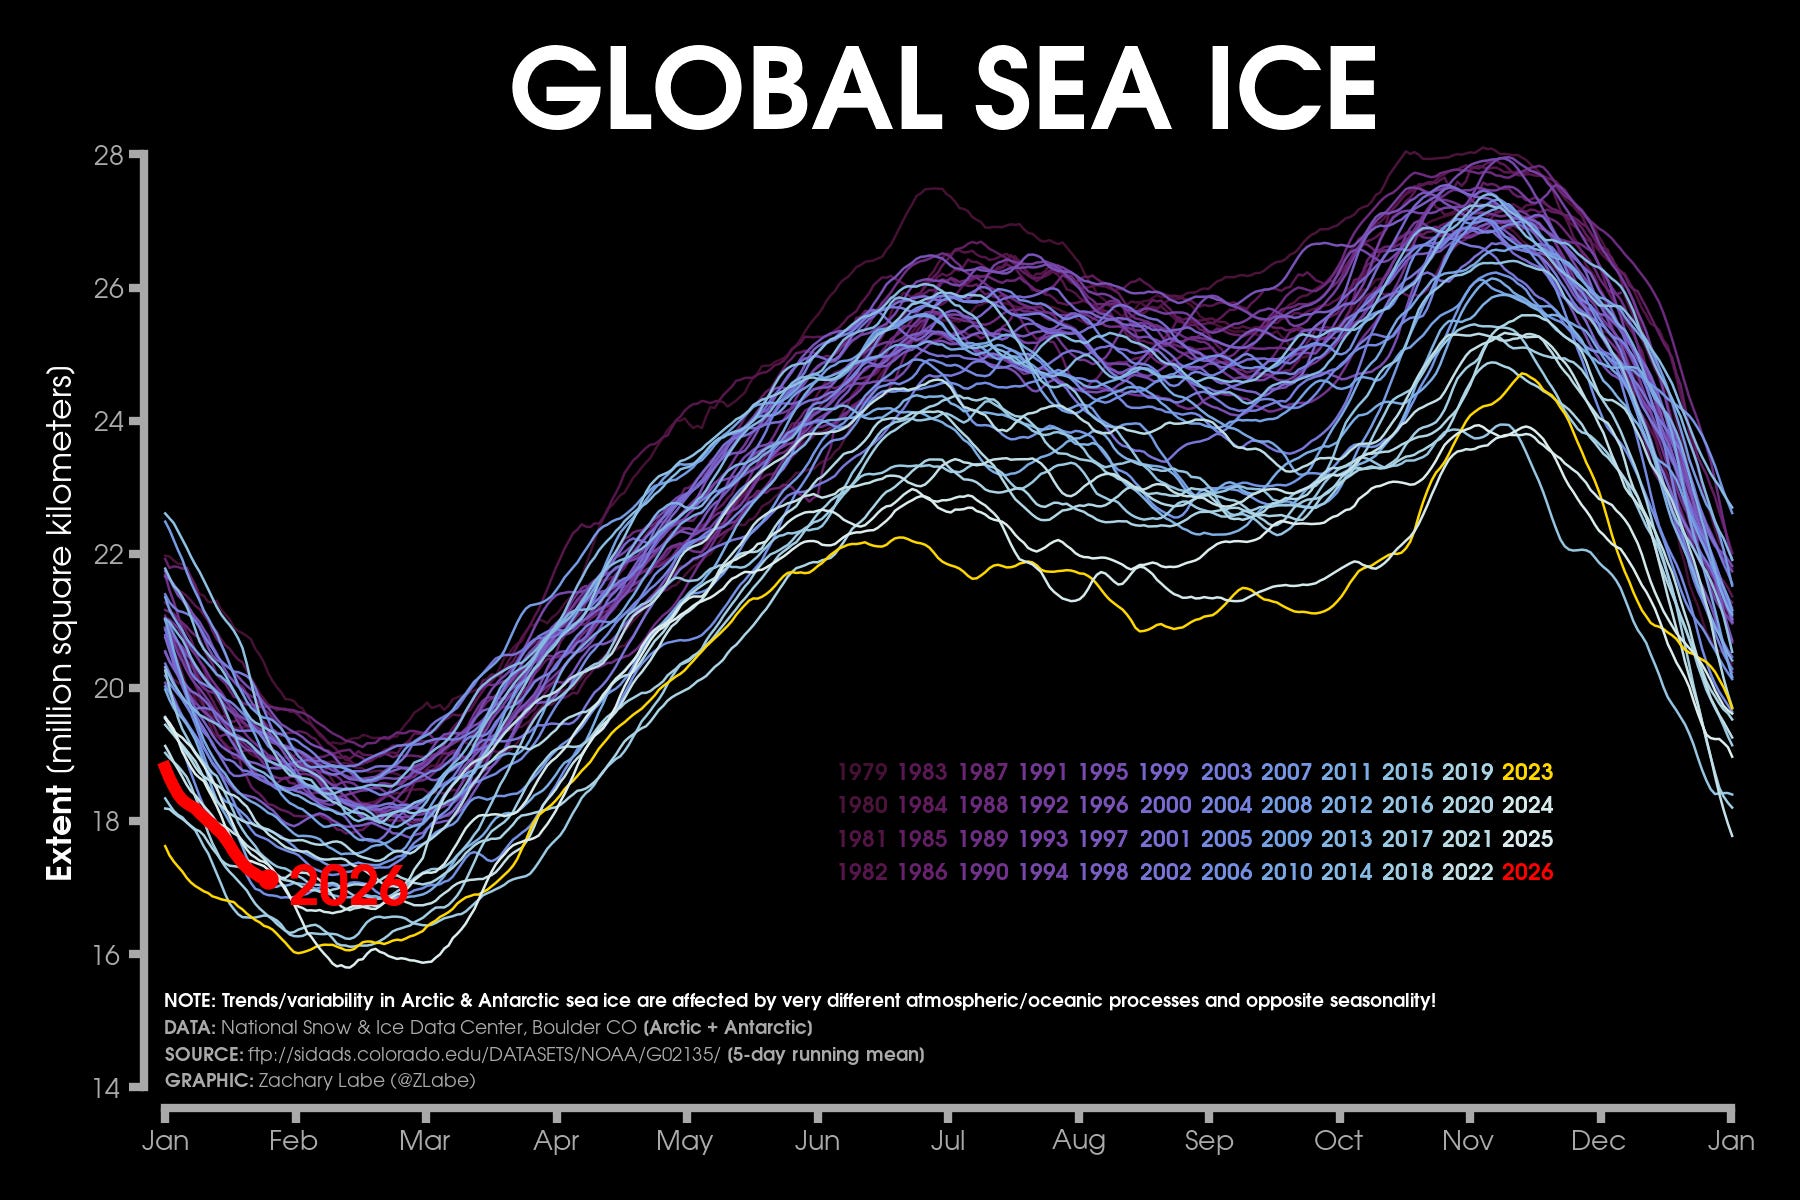
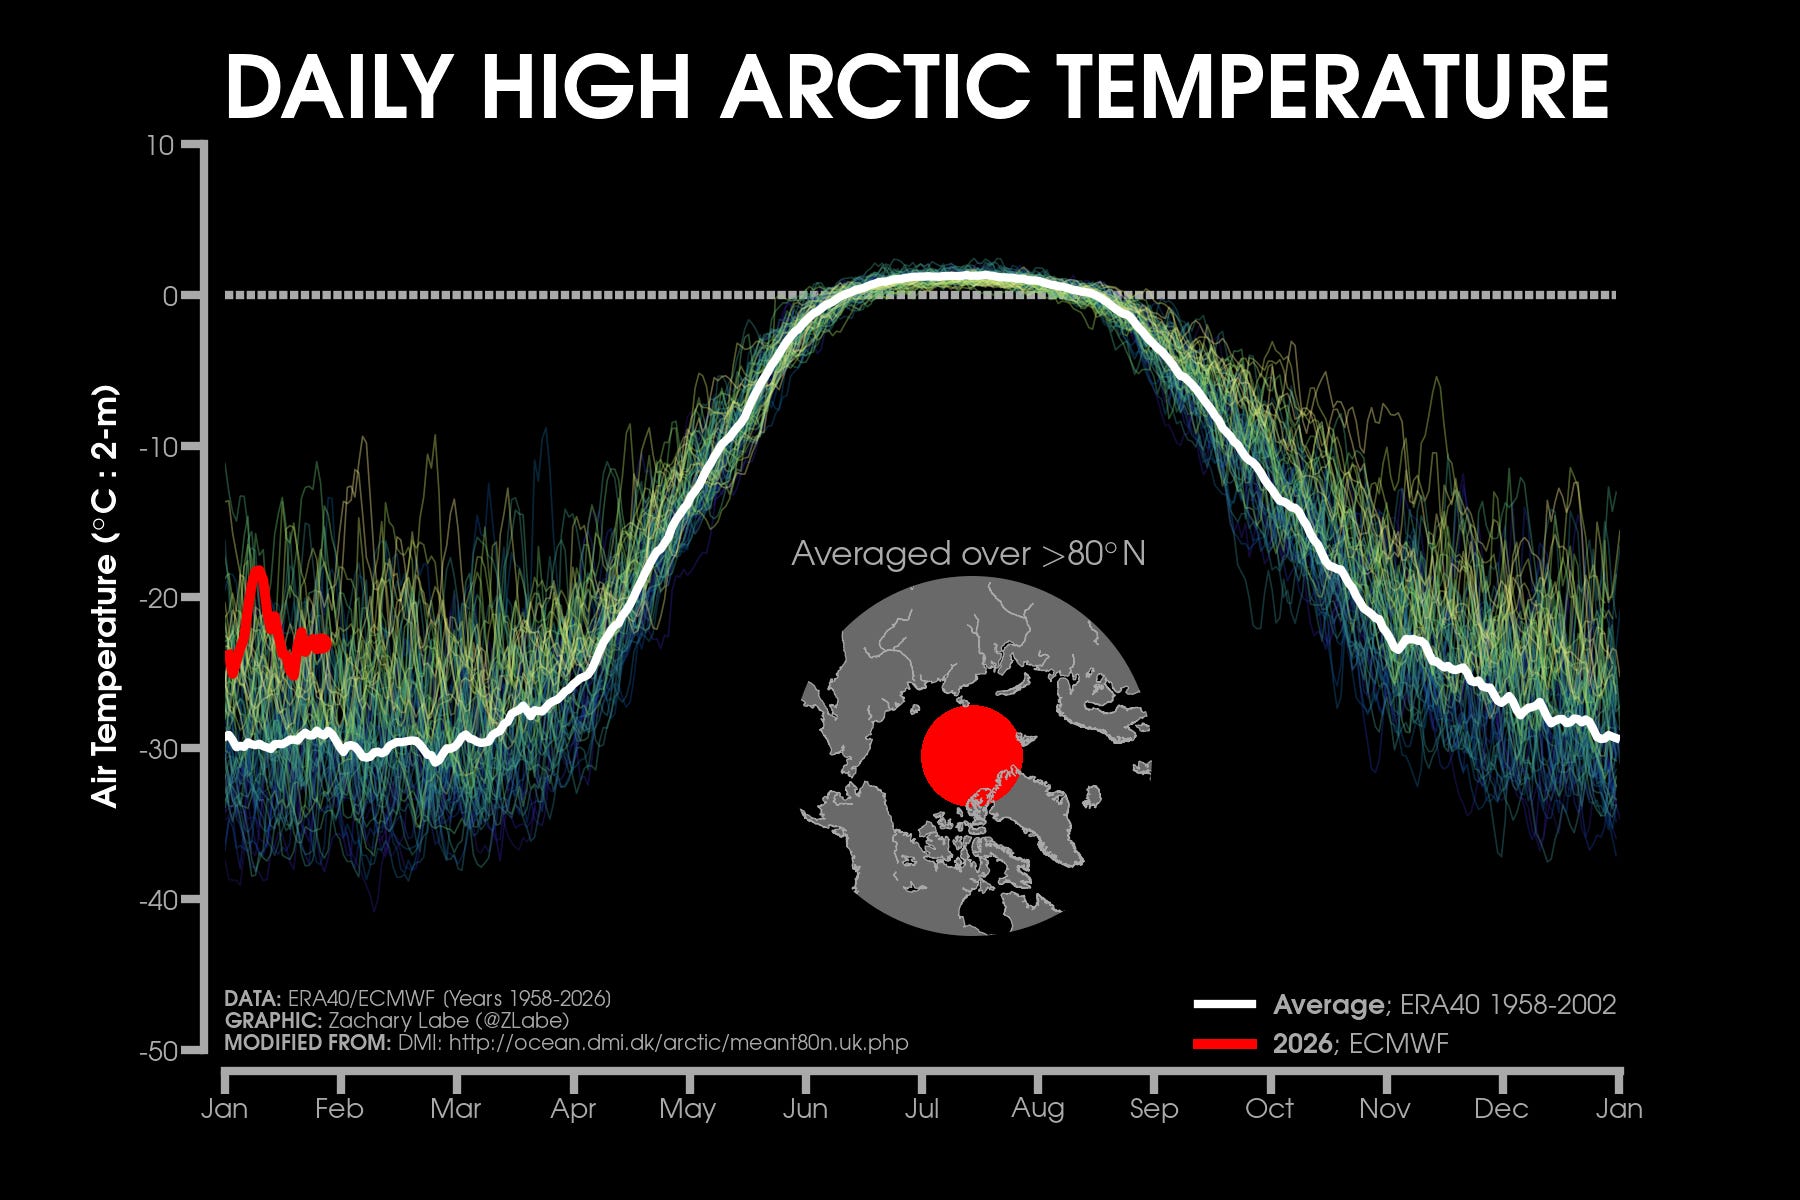
Related to this, something I have doubled down on is letting the data tell the story. For instance, I will often share a trend graphic without explicitly mentioning climate change, allowing viewers to interpret what they are seeing on their own.
Another piece I think is essential to better understand and communicate is uncertainty and natural variability in the climate system and how this influences short-term trends and different types of weather and climate extremes.
What’s your favorite, big question that you don’t have an answer to yet? Why do find it interesting and important? Any best guesses for an answer?
The most common question I get is when the Arctic will experience its first ice-free summer, and the honest answer is that we do not know yet.
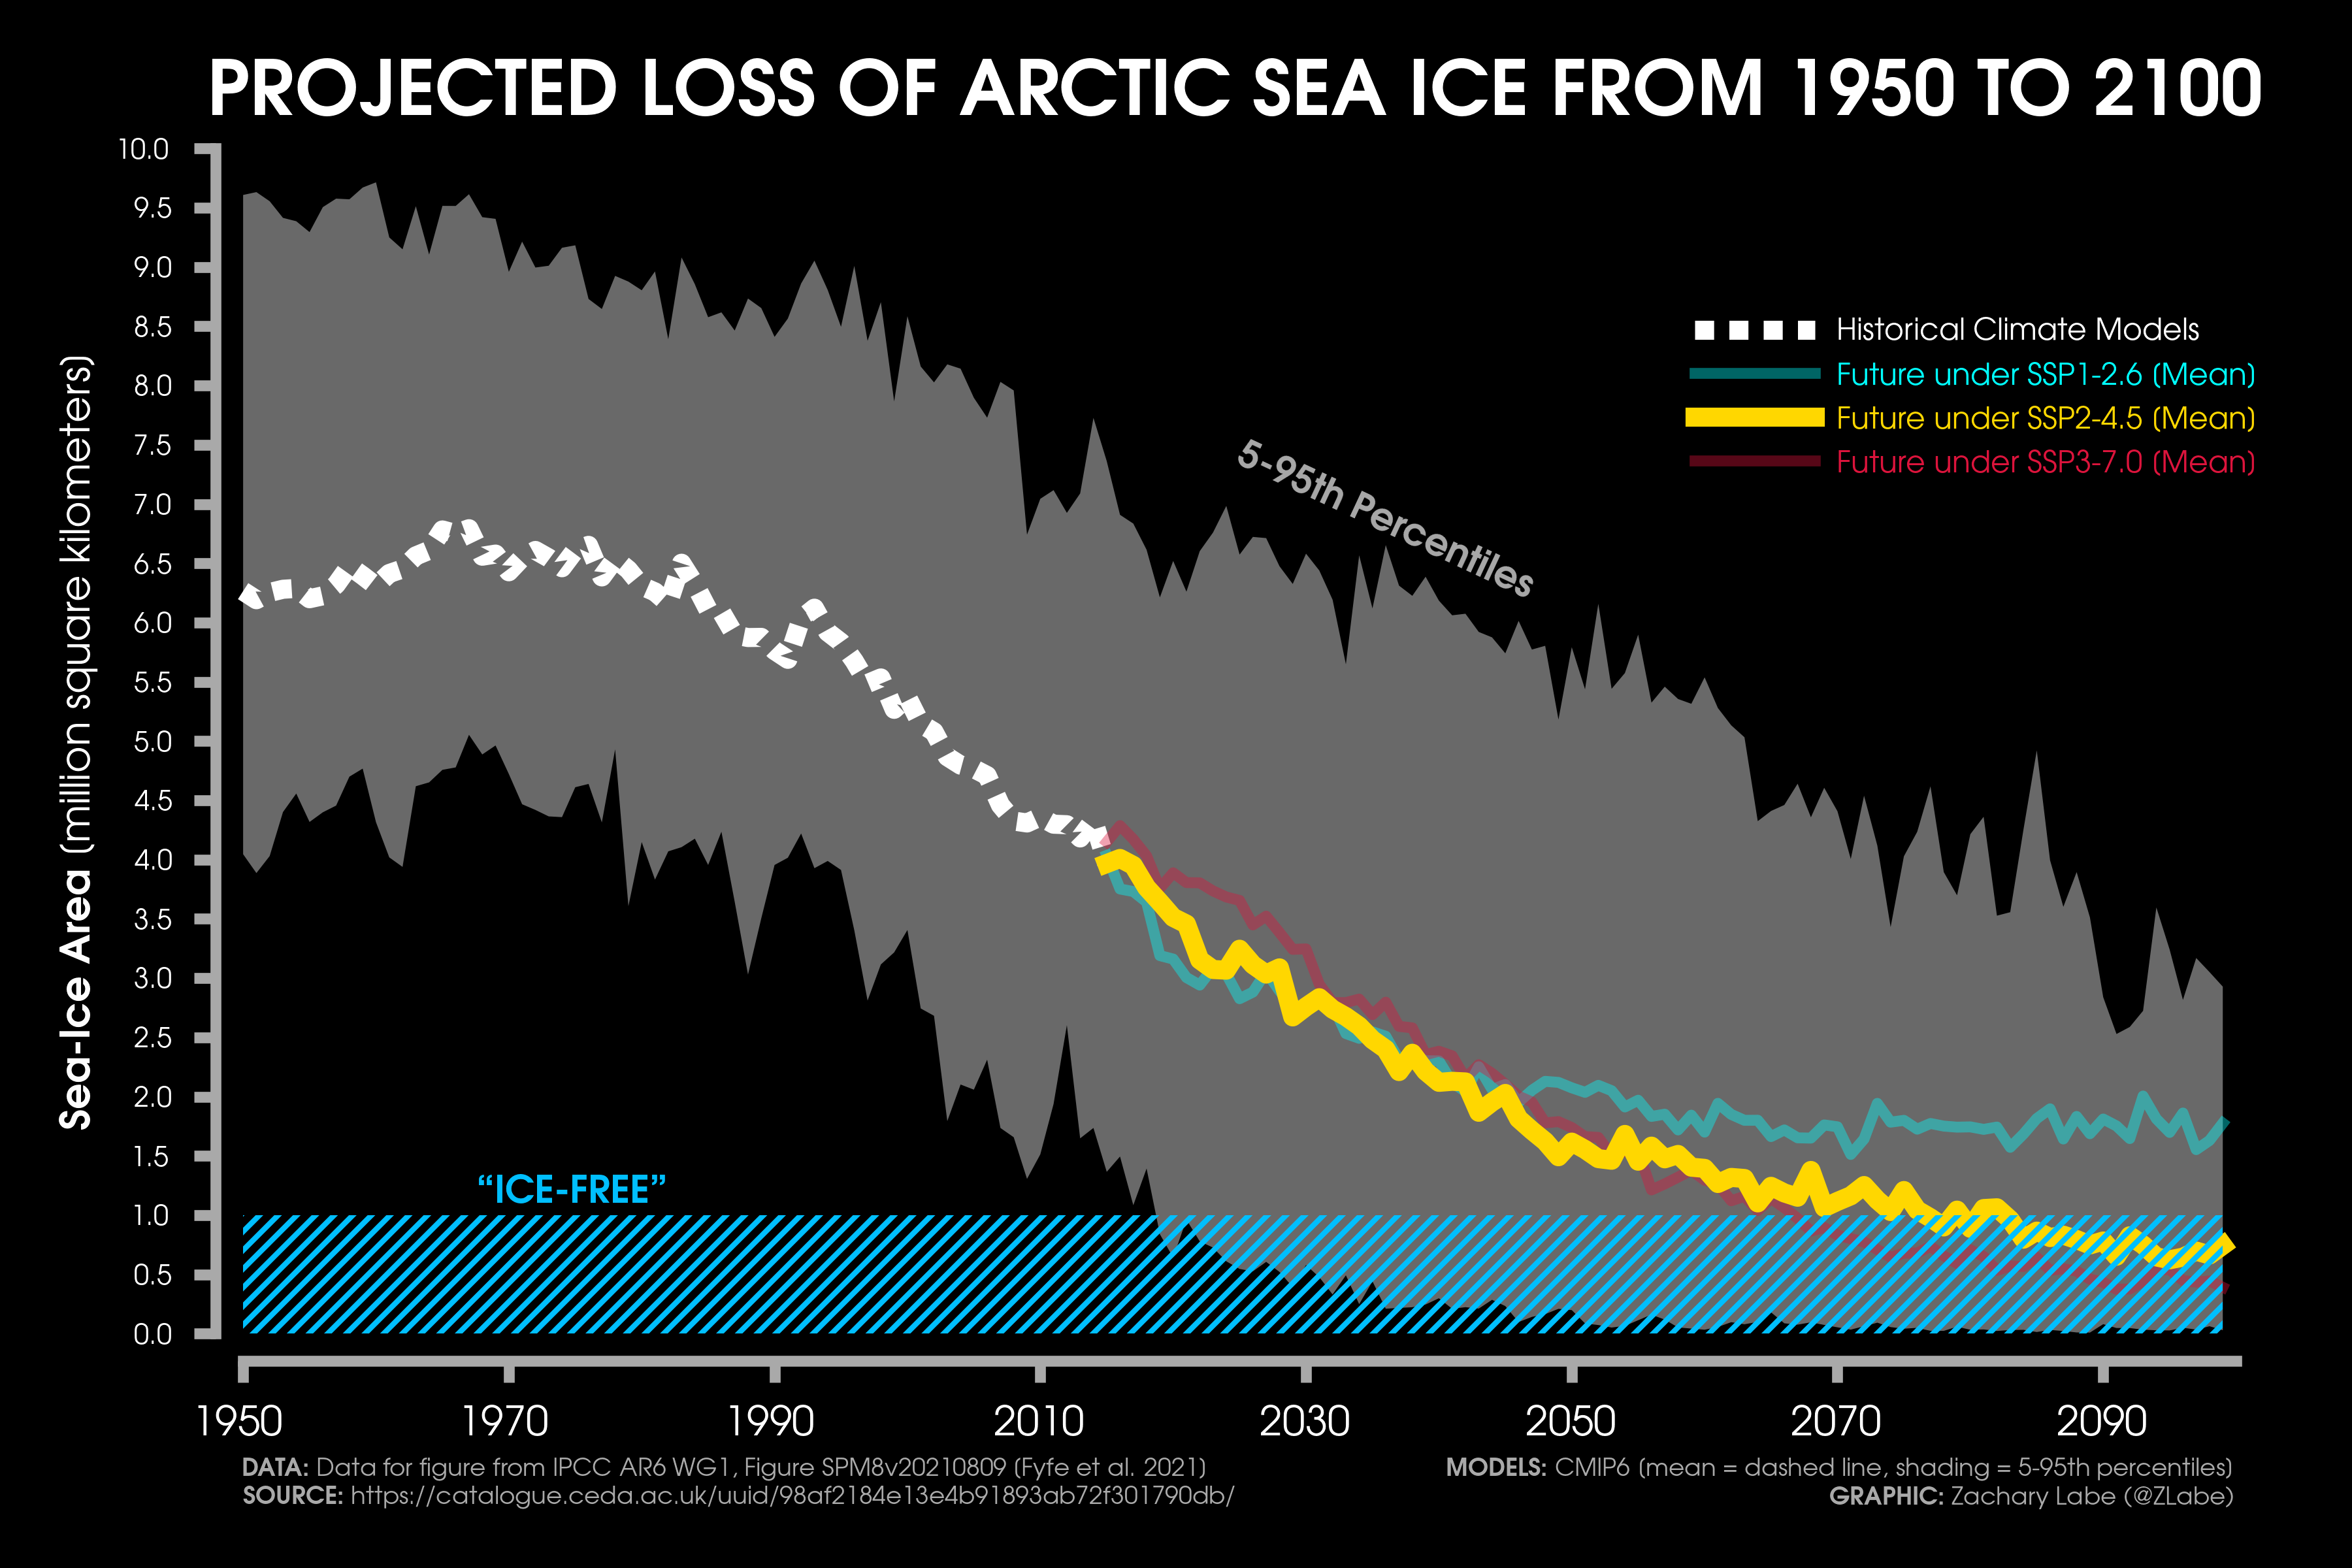
I am not even sure we will ever be able to pinpoint an exact year until it is very close to happening. While the long-term trend in Arctic sea ice is clearly downward, there is still substantial year-to-year variability driven by weather patterns and natural climate variability, which can temporarily speed up or slow down ice loss. That variability makes precise projections difficult, which is why estimates pointing to sometime in the mid-21st century remain reasonable.
This also reflects both uncertainty and the range of scientific methods used to study this problem. While it is an interesting and important question, it is also worth recognizing that continued ice loss itself is what drives impacts. From that perspective, there is very little difference in real-world consequences between a summer with 1.5 million square kilometers of sea ice and one with 1 million square kilometers, which is often used as the technical definition of “ice-free” in the scientific literature.
Looking back from a Net Zero future, what do you hope they will say about us?
I hope people say that we quickly recognized the importance of working together across countries and disciplines to solve big, complex problems like climate change.
I also hope we are seen as a period that strengthened collaboration across fields, along with recognizing that improving resilience, our environment, and society depends on clear communication of the science to build trust and ground decisions in facts.
Thanks, Zach 🙏
If you learned a thing or two, consider sharing this interview with a friend 🌳
Tangent #1: Weather data seems to be the talk of town in Europe. Today, the European Space Agency (ESA) announced that it’s next/third-gen satellite sent back its first images.
We’re looking at global surface- and cloud-level temperatures:

Off we go, little satellite!
Tangent #2: I’d love to hear from you, please get in touch and tell me whom I should interview next or which topics you’d like to see covered ✌️