

The Singing Ice Shelf
How Scientists Accidentally Tapped Into an Ice Shelf's Real-Time Health Updates

👋 Hello to 3,423 climate buddies 🌳
Delphi Zero explores the interplay of climate, energy, and security 🌳🔋🛡️
📧 If you are opening this essay in your email inbox, I recommend clicking on the title of this piece to enjoy the full-length version in the browser.
Hi there,
Welcome back to part 2 (out of 10) of the Sound of Antarctica: What the Quietest Continent Teaches Us About Paying Attention.
The Singing Ice Shelf
We’ll dive into the beautiful world of acoustics research and what it can teach us about the world around us. (+ I have a little surprise for you)
Let’s tune in 🎧
The Singing Ice Shelf
By Art Lapinsch
There’s a slab of ice floating in the Southern Ocean that’s roughly the size of France (or Texas… in case that’s easier to imagine).
It’s called the Ross Ice Shelf - 487,000 square kilometers of glacial ice, up to 750 meters thick in places, fed by slow rivers of ice pouring off the Antarctic interior. From the sea, its face is a wall of white rising 50 meters above the waterline, stretching 800 kilometers from one anchor point to another.

Early explorers called it simply “the Barrier.” James Clark Ross, who first encountered it in 1841, compared the futility of trying to sail through it to attempting the Cliffs of Dover.
It’s been there for thousands of years. It’s the largest ice shelf on Earth. And for all of those thousands of years, it’s been singing into the void.
In 2018 though, a team led by geophysicist Julien Chaput published a paper that changed how we think about Antarctic ice. The research team had buried 34 ultra-sensitive seismometers beneath the snow on the Ross Ice Shelf’s surface and left them there for over two years, from late 2014 to early 2017. They weren’t listening for music. They were trying to understand the shelf’s physical structure. But when they started analyzing the data, they noticed something nobody expected.
The ice shelf was humming. Constantly. A near-continuous vibration at frequencies above 5 Hz - far below the threshold of human hearing (>20Hz). A continent-sized instrument playing a song to an empty room.
What is the biggest slab of ice on the planet telling us while we are not listening?
📣 Interlude: Q&A with Julien Chaput
When writing this piece, I did a Hail Mary and emailed Julien to ask him a question about their experience. What’s better than to hear it from the researcher himself.
So, here’s your surprise. Despite being busy, he was kind enough to respond 👇
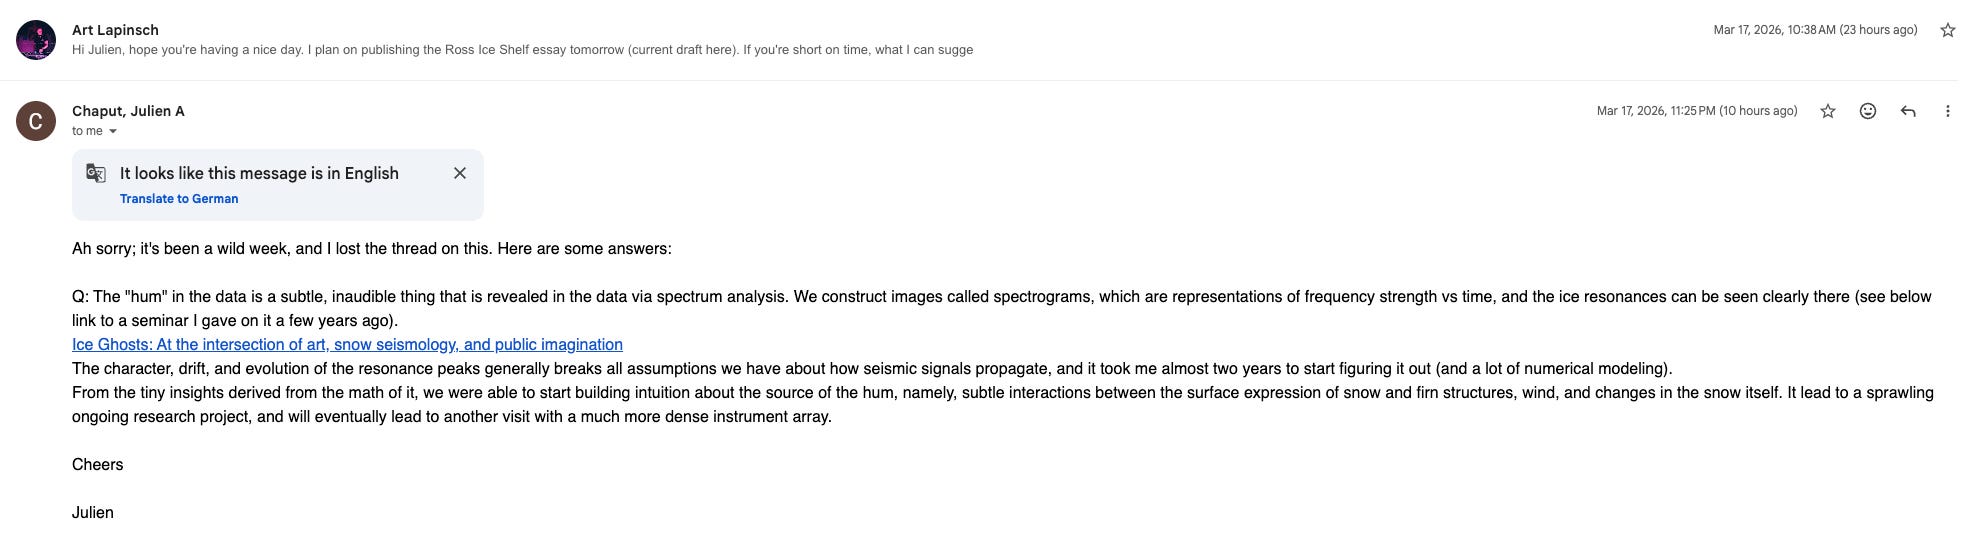
Q: When you first noticed the continuous hum in the data, did you and your team know immediately what you were looking at? What did it feel like and how did the situation evolve?
Julien: The “hum” in the data is a subtle, inaudible thing that is revealed in the data via spectrum analysis. We construct images called spectrograms, which are representations of frequency strength vs time, and the ice resonances can be seen clearly there (see below link to a seminar I gave on it a few years ago).
The character, drift, and evolution of the resonance peaks generally breaks all assumptions we have about how seismic signals propagate, and it took me almost two years to start figuring it out (and a lot of numerical modeling).
From the tiny insights derived from the math of it, we were able to start building intuition about the source of the hum, namely, subtle interactions between the surface expression of snow and firn structures, wind, and changes in the snow itself. It lead to a sprawling ongoing research project, and will eventually lead to another visit with a much more dense instrument array.
How Ice Learns to Sing
Here’s how it works.
The Ross Ice Shelf isn’t bare ice. It’s covered in a thick blanket of compacted snow - what glaciologists call the “firn layer” - that can extend several meters deep. This firn layer acts as insulation for the ice beneath, a kind of thermal fur coat protecting the shelf from surface temperatures. On top of that firn sit massive snow dunes, sculpted by Antarctic winds into formations that look like a frozen desert.
When those winds blow across the dunes - and they blow constantly - they set the firn layer vibrating. Like a flute being played nonstop.
The analogy is more precise than it sounds. A flute produces different notes depending on which holes are open and how fast the air moves through them. The Ross Ice Shelf works the same way. Two forces shape the pitch: wind speed reshaping the dune topography (changing where the air interacts with the surface) and air temperature altering the speed at which seismic waves travel through the snow (changing the medium itself). Strong storms rearrange the dunes and the frequency shifts. Temperature rises or drops and the frequency shifts again.
Chaput’s team observed both gradual spectral changes over months and rapid shifts on the scale of hours. They recorded frequency excursions of up to several hertz. They even detected a January 2016 regional melt event - a moment when surface temperatures approached 0°C and weakened the snow lattice - through the change in the shelf’s acoustic signature alone.
They detected structural change in the ice by listening to it.
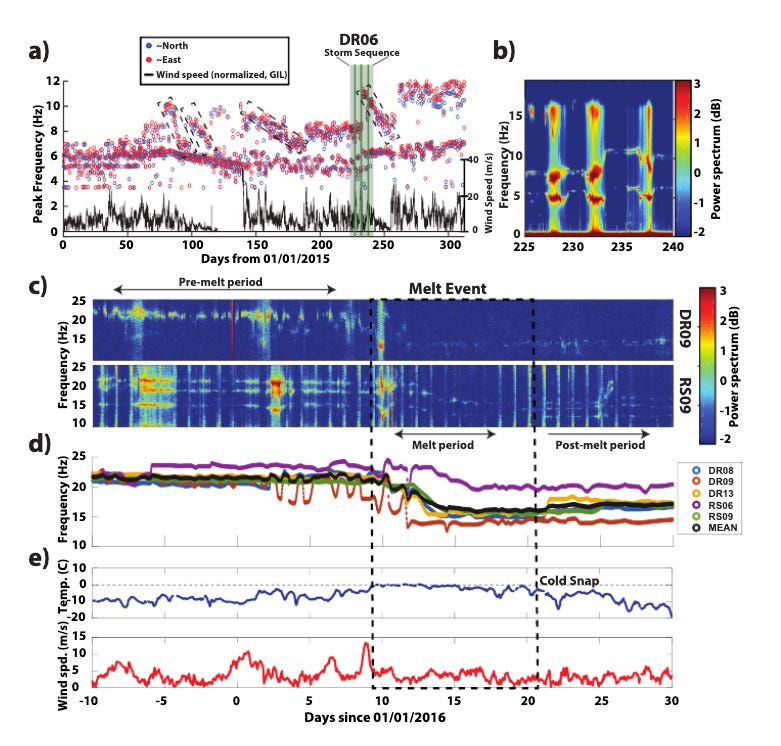
The firn layer’s seismic behavior turned out to be extraordinarily sensitive to near-surface conditions. The spectral peaks the team observed - those narrow bands of resonant frequency between roughly 4 and 50 Hz - responded to everything happening in the top several meters of the shelf. Wind redistribution of snow. Formation of melt ponds. Refreezing events that created new percolation layers beneath the surface. Each of these processes left a distinct fingerprint in the acoustic data.
This isn’t a metaphor. The Ross Ice Shelf is broadcasting its vital signs in real time, 24 hours a day, to anyone with the right instrument pointed at it. The seismic hum is a continuous readout of the shelf’s structural health - its temperature, its density profile, its response to storms, and its vulnerability to the kind of surface melting that precedes catastrophic breakup.
Why This Matters More Than You Think
Here’s where I need you to hold two numbers in your head.
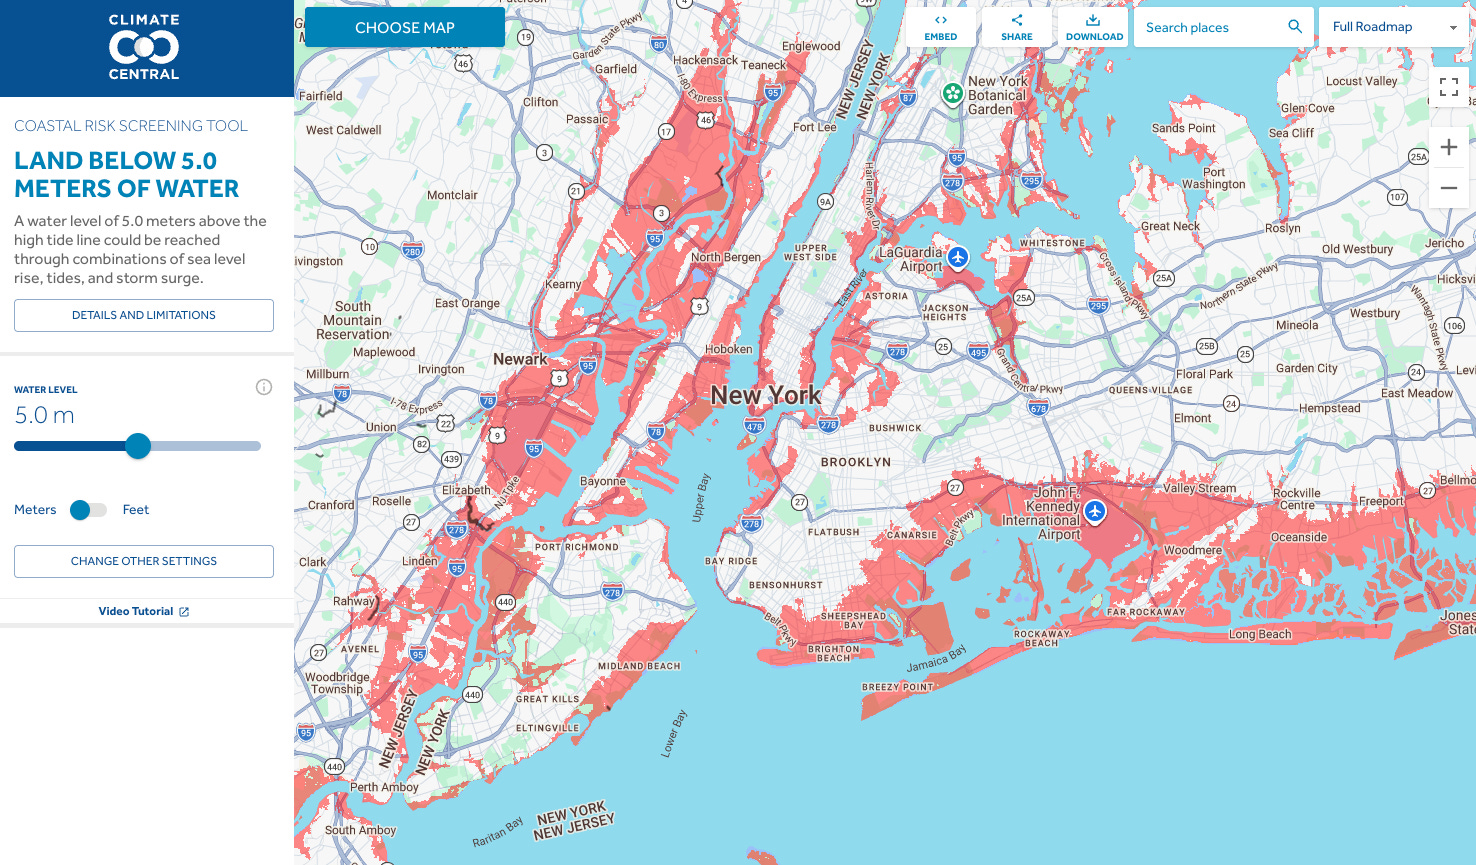
The first number: 5 meters. That’s how much global sea levels would rise if the West Antarctic Ice Sheet - the mass of grounded ice behind the Ross Ice Shelf - flowed unimpeded into the ocean. The USGS puts the total at 11.6 meters. Five meters is the conservative estimate for the portion most at risk. Five meters redraws the coastline of every continent on Earth.
The second number: eightfold. That’s the factor by which glacier flow can accelerate after the ice shelf holding it back collapses. We know this because we’ve watched it happen. When the Larsen B Ice Shelf on the Antarctic Peninsula disintegrated in 2002 - 3,250 square kilometers of ice, gone in a month - the glaciers behind it accelerated two- to six-fold almost immediately. Their mass loss jumped from 2–4 gigatonnes per year to somewhere between 22 and 40 gigatonnes per year. The Crane Glacier alone tripled in speed.
The Larsen B was roughly the size of Connecticut. The Ross Ice Shelf is roughly 100x the size.
Ice shelves are the corks in the bottle. They exert back-pressure on the glaciers feeding them, slowing the flow of land ice into the sea. When the cork pops, everything behind it accelerates. And once it starts, we don’t have a way to put it back.

Now, the Ross Ice Shelf is currently considered relatively stable. That word “currently” is doing a lot of work. Research has shown that warm ocean water is eroding the shelf from below - parts of it are losing 10 to 20 meters of thickness per decade. The firn layer - the same fur coat that generates the singing - is the shelf’s first line of defense against surface melting. If the firn weakens, melt ponds form. Melt ponds drive water into crevasses. Water in crevasses drives a process called hydrofracture - think “fracking done by nature”. Hydrofracture is what killed the Larsen B.

This is where the singing becomes more than a curiosity. Chaput’s discovery means we can monitor the firn layer’s health continuously, passively, from seismic stations that cost a fraction of satellite missions and aren’t limited by orbital passes or cloud cover. Changes to the hum - shifts in frequency, amplitude, spectral pattern - can tell us whether melt ponds or cracks are forming before they become visible from space. A tool to monitor the environment and its impact on the ice shelf. (At this point, I’m thinking that this data would be perfect for machine learning systems to uncover hidden correlations/insights.)
The shelf was telling us about its health long before anyone was listening. The signal was always there.
A Listening System That Already Exists (And Three That Should)
The Ross Ice Shelf discovery sits inside a broader revolution in passive acoustic monitoring (PAM) - the science of learning by listening rather than probing. It turns out the planet is broadcasting an enormous amount of critical data acoustically, and we’ve only recently started building systems capable of hearing it.
One existing system is the following 👇
The NOAA/NPS Ocean Noise Reference Station Network (URL)
A network of 13 calibrated hydrophone moorings distributed across U.S. waters - from the Arctic to the tropics, spanning the continental shelf, Hawaii, and American Samoa.
Deployed starting in 2014, these stations record continuously in the 10–2,000 Hz band, capturing anthropogenic noise (shipping, drilling), biological signals (whale calls, fish choruses), and geophysical sounds (storms, ice).
The explicit goal: establish long-term baselines so we can actually measure how the ocean soundscape is changing. You don’t know what abnormal means if you’ve never defined normal.
![Retrospective on decadal progress of the NOAA/NPS ocean noise reference station network [PeerJ]](https://substackcdn.com/image/fetch/$s_!qGjC!,w_1456,c_limit,f_webp,q_auto:good,fl_progressive:steep/https%3A%2F%2Fsubstack-post-media.s3.amazonaws.com%2Fpublic%2Fimages%2F43489d58-37f9-47c8-a6c3-a5dd54e1189d_2905x1446.bin "Retrospective on decadal progress of the NOAA/NPS ocean noise reference station network [PeerJ]")
Now let’s go into day-dreaming territory. Three types of PAM installations that should exist but don’t (yet)👇
#1: An Acoustic Monitoring Ring Around the Antarctic Ice Sheet
Right now, seismic monitoring of Antarctic ice shelves is ad hoc - individual research deployments lasting two or three years, covering fractions of specific shelves.
Imagine a permanent, interconnected ring of broadband seismometers covering every major ice shelf: Ross, Ronne-Filchner, Amery, the remnants of the Larsen system.
Continuous, real-time monitoring of the firn hum across all of them. The shift from sampling to surveillance. Early warning not for one shelf, but for the entire system.
The technology exists. The models exist. What’s missing is the institutional will to treat acoustic monitoring of ice shelves as critical infrastructure rather than research curiosity.
Big Data sensor system at continental scale. A man can dream.
#2: Acoustic Monitoring of Offshore Wind Farm Foundations
Offshore wind is scaling fast - thousands of turbines being driven into the seabed across the North Sea, the U.S. Eastern Seaboard, the Baltic. Each foundation is subject to fatigue and structural degradation that’s extremely expensive to inspect by sending divers or ROVs (i.e. robotic submarines).
Passive acoustic monitoring of the structural resonance of these foundations - listening for shifts in vibration patterns that signal fatigue cracks, loosened grouting, or scour undermining the base - could provide continuous structural health data at a fraction of the cost of periodic inspection. The same principle as the singing ice shelf: if the structure is resonating, changes in the resonance tell you something about the structure.
#3: Acoustic Early Warning for Subsea Methane Release
Methane hydrates - frozen deposits of methane locked in sediment on the ocean floor - represent both a potential energy source and a climate wildcard.
As ocean temperatures rise, these deposits can destabilize, releasing methane (roughly 80 times more potent than CO₂ over 20 years) into the water column and atmosphere. The release of methane from hydrate deposits produces distinctive acoustic signatures - bubbles, sediment displacement, changes in seafloor resonance. A network of passive acoustic monitors on the Arctic continental shelves, where hydrate deposits are most vulnerable to warming, could serve as an early detection system for large-scale methane release events.
We have satellites watching the surface. Nobody’s listening to the floor.
You Can’t Grasp What You’re Not Measuring
I spent a decade in adtech before before diving into climate/energy. It’s crazy how much this industry resembles the early days of online advertising.
In early digital advertising, you had massive amounts of signal - user behavior, click patterns, engagement data - but most of it was hidden. Not because it wasn’t valuable. Because the infrastructure to capture, process, and act on it in real time didn’t exist yet. The data was there. The pipes weren’t.
The companies that figured this out first - that built the signal-processing infrastructure before anyone else understood why it mattered - ate the market. The insight wasn’t “users generate data.” Everyone knew that. The insight was: the gap between available signal and deployed measurement infrastructure is where all the value lives.
That gap is exactly where climate science is right now with passive acoustics.

The Ross Ice Shelf has been singing for millennia. The Southern Ocean has been propagating iceberg collisions at 190+ dB for as long as there have been icebergs. Whale calls have been crossing entire ocean basins since before humans existed. The data has always been there. We’re in the early innings of building the pipes.
And here’s the thing that really maps from adtech: the signal you’re not looking for is almost always more valuable than the signal you are looking for. Chaput’s team deployed seismometers to study the Ross Ice Shelf’s structure and stumbled into a continuous health-monitoring system. This is a pattern. When you build the infrastructure to listen at scale, the most important discoveries aren’t the ones you planned for.
The Ross Ice Shelf is still singing. Right now. Winds are blowing across its snow dunes setting the firn layer vibrating at frequencies you’ll never hear with your ears. The pitch is shifting with the weather, tracking every storm, every temperature swing, every subtle rearrangement of the surface.
It’s the longest-running performance on Earth. And for most of human history, the audience was empty. One research team proved that we can tap into it.
Now the next question is for you: Who (or what) is performing right under your nose while you’re not paying attention to it?
Thanks for reading and thanks (a) to Julien and his team for their research effort and (b) Julien himself to take the time to respond to my email.
Next time: The ice doesn’t just sing. Sometimes it screams - and when it does, hydrophones in Australia pick up the phone.
See you in two weeks. Latest. 🧊
This is Part 2 of “Sound of Antarctica,” a 10-part series on what the quietest continent teaches us about paying attention.
It’s wild how different elements of nature mimic each other. Just like ice shelves, trees also “scream” (same low frequency hum / vibrations) when they’re parched.
There was a project to estimate changes in ocean temperature via changes in the speed of propagation of sound over thousands of kilometers. The idea was that sound speed in seawater is partly a function of temperature. And there's a kind of "waveguide" in the ocean where the speed of sound in seawater (average ~ 1500 meters per second) is at a minumum because that speed is a function of *both* temperature and pressure; it's a layer known as the "SOFAR" channel. The idea was if you could keep monitoring the speed of sound over years-to-decades you could keep track of ocean warming. see: https://staff.washington.edu/dushaw/heard/index.shtml